Our impact dashboard is a user friendly way to show how 211 work to identify met and unmet needs and impact communities. This simplified dashboard provides some basic information about 2-1-1 service usage in Illinois.
Data
Impact Dashboard

Analytics Dashboard
The analytics dashboard lets you dive deeper into the 211 Illinois statewide data. With more filters, maps, and charts, it is a one-stop shop for learning more about 211 traffic in Illinois.
Legislative Reports
The legislative reports help elected officials understand more 2-1-1 service impact in their districts. This one page report is a quick outline of the 2-1-1 service trend for both Illinois Hours and Senate and the National reports.


Township Reports
The township reports help elected officials in smaller townships to better understand 2-1-1 service impact in their area. This one page report is a quick outline of the 2-1-1 service trend.
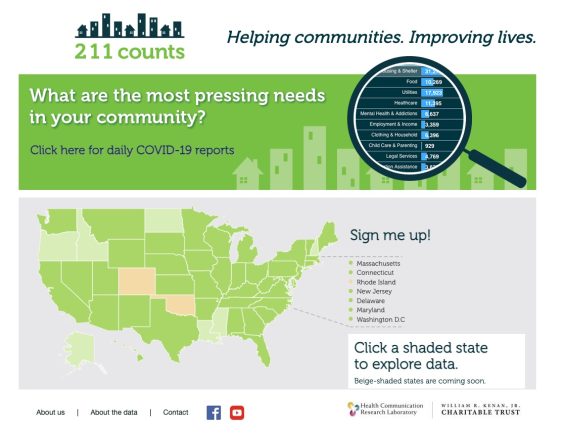
211 Counts National Reporting
2-1-1 Counts was created by the Health Communication Research Laboratory at Washington University in St. Louis. 2-1-1 Counts provides searchable and visualized data from 2-1-1 call centers across the nation. 2-1-1 Counts works with 211 Illinois to share this information nation-wide.

211 Illinois Annual Reports
View our past annual reports detailing 211 Illinois activities. You can find more recent information on our 211 Dashboard.